MPERS underwent a significant asset allocation change in Fiscal Year 2019. As of January 1, 2019, MPERS increased its policy target allocation to global equities from 30% to 40%, increased the policy target to traditional fixed income from 20% to 22.5%, and increased its target to real assets from 7.5% to 10%. The subsequent changes that allowed for those reallocations were a policy target reduction to private equity from 15% to 10% and to hedge funds from 10% to 0%. As part of the new asset allocation, MPERS will begin reporting investments in a beta group construct. The beta groups are equities, rates and credit, and real assets. These groupings provide a framework to align the various portfolio exposures, regardless of the structure of the investment vehicle, and allows for more transparent reporting of alternative assets according to their underlying market (or beta) exposure. As it relates to hedge funds, they will no longer represent a standalone asset allocation but will be allocated according to the market risk represented in the underlying strategy or will be part of the portable alpha program within the equity beta group. The use of hedge fund strategies is subject to a 10% cap across all underlying beta groups. Additionally, the Board approved a widening of the bands around each target allocation from 5% to 7.5%.
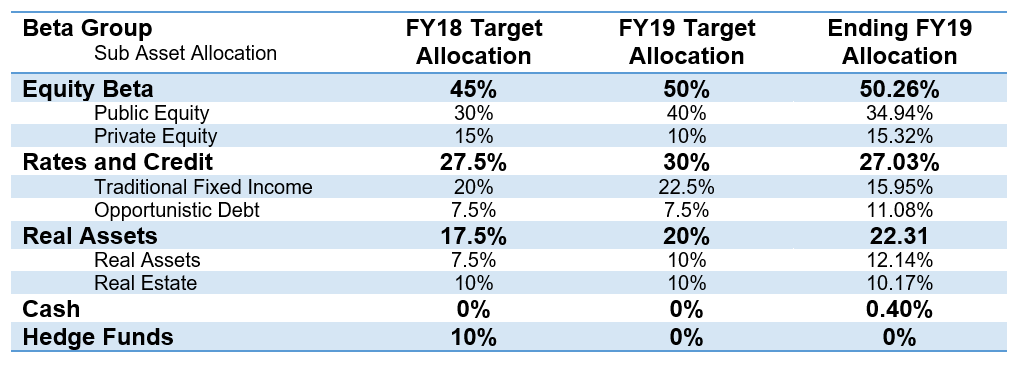
As of June 30, 2019, all of the sub-asset class allocations were within the acceptable ranges established by MPERS’ Investment Policy. Currently, there is a wider divergence relative to the target allocation which is a result of the asset allocation shift that took place on January 1, 2019. Staff continues to work toward bringing the actual allocation closer to those targets, but is aware that the transition will take time and makes conscious decisions based on the staff’s view of the market. The table below lists the target allocations as June 30, 2018, along with the target and actual asset allocation as of June 30, 2019, using the new beta group construct. Following the table are descriptions of each new beta group and its underlying assets.
 Equity Beta
The equity beta group is comprised of three asset types: public equity, private equity and hedged equity. The equity beta group currently represents 50.26% of the overall portfolio, essentially neutral to the target allocation of 50%. Within that overall equity allocation, the fund is overweight private equity structures (15.3% versus the new target of 10%), which is offset by an underweight to public equity (34.9% versus new target of 40%). In addition, 5.6% of the 35% of public equity is within the hedged equity allocation which did not have the same market exposure as the broad equity benchmarks for the majority of the fiscal year. The result of the current positioning is a considerable underweight to the traditional equity markets, which marred the fund’s relative performance during the equity market rally since January 1, 2019.
Public Equity
Public equity markets performed altogether differently from one half of the year to the next in Fiscal Year 2019. During the first half of the year (the second half of calendar year 2018), markets fell significantly as rising interest rates threatened to choke off the economic expansion. Investors were also concerned over the escalating trade tensions between the U.S. and China. The fourth quarter of 2018 was especially challenging as global equities fell 12.8% which left equities down over 9.0% for the calendar year. As the calendar turned over to 2019, market sentiment turned positive as the Federal Reserve and central banks across the globe once again stepped in to support the markets. The pivoting of the Federal Reserve to a more accommodative stance (signaling future interest rate cuts) sent bond yields tumbling lower and investors back to the equity markets. Global equity markets rallied over 16% in the first half of 2019, erasing the losses from the prior six months and ending Fiscal Year 2019 with a 5.7% return.
MPERS’ public equity portfolio struggled to keep up with the policy benchmarks for the year, generating an overall 1.1% return relative to the 5.7% benchmark return. MPERS’ value bias, use of master limited partnerships (MLPs), and the overweight to small cap equities all underperformed the broader public benchmarks. Confidence continues, however, that these tilts will serve the portfolio well over the long term, but staff will monitor whether to deemphasize them if underperformance continues.
Hedged Equity
As part of the revised asset allocation on January 1, 2019, MPERS moved away from a standalone hedge fund target of 10% in favor of using certain hedge funds within a portable alpha construct in the global equity portfolio. Alpha is the return that is earned over the overall market return. The use of portable alpha involves taking the alpha that hedge fund managers can generate, and “porting” that alpha over the overall market return. To implement this approach, staff monitors the overall equity market risk (beta) within the hedge fund managers. For Fiscal Year 2019, the hedge funds utilized in the hedged equity allocation had a beta that ranged between 0.4% and 0.5%. It is expected that the hedge fund portfolio will gradually transition to a market neutral (or low to no beta portfolio) over the next few years, but regardless there must be an appropriate adjustment to account for the market risk embedded in the hedge fund portfolio relative to the broader equity markets. After calculating the current beta of the hedge fund managers, staff overlays additional equity exposure to move the beta of the entire portfolio closer to 90-100%. Hedged equity implies an overall less volatile equity portfolio given the hedge fund managers ability to deliver alpha, and an overall beta (market risk) below 100%. As of June 30, 2019, hedged equity represented 5.6% of the overall portfolio (or approximately 11% of the equity portfolio), using the S&P 500 as the desired market exposure.
Private Equity
On January 1, 2019, MPERS lowered the target to private equity from 15% to 10%. While private equity continues to be the best performing asset class in MPERS’ portfolio over the long term, staff is cognizant of the massive amounts of money raised in the sector over the past several years and the risks that it brings to future performance. Staff remains disciplined by slowing the investment pace and not “following the herd” of capital that is aggressively coming to the market during this late stage of an economic recovery. New commitments are focused on existing managers who are coming back to market and who have performed well and because the new commitments are focused on a smaller group of funds, it will take several years to transition the portfolio to the lower targets. Distributions from existing investments continue to occur at a strong pace. As less money is committed to new funds during the coming years, the allocation to private equity should gradually decline in the direction of the new targeted allocation.
Private equity generated a 16.22% fiscal year return, surpassing the benchmark (S&P 500 + 3%) return of 12.76%. The “public equity plus” benchmark has been difficult to outperform given the strength of public equity markets coming out of the financial crisis and the relative immaturity of MPERS’ private equity portfolio. Relative performance over longer time periods should continue to improve as the private equity portfolio continues to mature and more underlying companies advance toward their ultimate exit strategy. The portfolio continues to mature nicely as evidenced by Fiscal Year 2019 being the fifth consecutive year where distributions from investments outpaced new capital calls.
Rates and Credit Beta
The rates and credit beta group consists of the traditional fixed income portfolio and the opportunistic debt portfolio. The overall allocation stands at 27% versus the new target of 30%. The portfolios performed largely in line with their respective benchmarks in Fiscal Year 2019, with the traditional portfolio delivering an 8.6% return (versus the benchmark of 8.5%) and the opportunistic debt portfolio generating 7.3% (versus the benchmark of 7.5%).
Traditional Fixed Income
MPERS remained consistently underweight the targeted fixed income allocation of 20% throughout the first half of the year and ended the year with a larger underweight of a 15.95% allocation compared to the new target asset allocation of 22.5%. Yields on the U.S. Treasury bonds fell considerably during the year, with the 10-year Treasury bond falling from 2.86% to 2.00% and the 30-year Treasury bond dropping from 2.99% down to 2.53%. The falling interest rate environment sent existing bond prices higher, which led to an 8.6% return for MPERS’ traditional fixed income portfolio.
The falling yields in traditional fixed income markets create a dilemma for pension investors looking forward. While fixed income strategies (particularly long duration treasuries) offer the best diversification against equity market risk, their low yields create challenges in meeting MPERS’ long-term actuarial return target of 7.0%. At the time of this report, the 30-year Treasury bond had a yield of roughly 2.0%. Simple mathematics show that for every dollar invested that earns 2.0%, another dollar must be invested in “something” that earns 12% to generate an average return of 7.0%. With the economy entering the “late-cycle” by most any metric, very few strategies have the potential to generate those returns. The dilemma is that investing in the asset class that offers the best protection against equity market risk is also the same asset class that virtually guarantees underperformance of the actuarial hurdle in the coming years. For these reasons, opportunistic debt strategies are favored over the traditional fixed income markets.
Opportunistic Debt
The offset to MPERS’ underweight position to traditional fixed income is the overweight position to opportunistic debt strategies. The year began with a 10.25% allocation relative to a 7.5% policy target and increased the allocation slightly to end the year at 11.08%. The asset class generated a 7.44% return which was essentially in line with its benchmark return of 7.48%. The publicly traded high-yield benchmark suffered during the first half of the fiscal year but rallied significantly in the second half. Over the two years since opportunistic debt performance was reported separately, it has generated 9.7% returns compared to the benchmark of 5%.
The opportunistic debt portfolio is diversified among direct lending, public market investments and distressed investments. To date, the portfolio is largely built out and most of the focus is on pivoting commitments away from direct lending and toward strategies that have flexibility to be more opportunistic. Direct lending involves making loans to healthy companies, generating high current income and benefits from stable and growing economies. As the economic cycle continues to mature and growth begins to slowdown, there is an increasing likelihood that the next several years will offer a better opportunity set for managers who focus on taking advantage of market volatility. Direct lending will remain an important part of MPERS’ portfolio, but most recent commitments to the space have been to sector-focused or niche-oriented managers. The pace of new commitments is also expected to slow in anticipation of a more interesting environment in the coming years.
Real Assets Beta
The real assets beta group includes MPERS’ real estate holdings along with the broader real asset strategies, e.g., energy, infrastructure, timber, and mining. Overall, this beta group performed well in Fiscal Year 2019, with real estate generating a 10.5% return (versus the benchmark of 6.0%) and the broader real assets sector generating a 6.5% return (versus the benchmark of 5.7%).
Real Estate
The underlying real estate allocation has a target of 10% of assets and includes a mix of public and private equity strategies, along with tactical exposures to public and private debt strategies. MPERS started the year with a 9.73% allocation and marginally increased the allocation, ending with a 10.17% allocation. The portfolio generated a 10.48% return for the year, outperforming the policy benchmark return of 6.00%. All strategies within real estate performed well during the year. The core real estate portfolio (primarily stabilized and fully leased properties) generated an 8.92% return, while the non-core portfolio (value-added or opportunistic real estate strategies) returned an impressive 12.72% return. The publicly traded REIT (real estate investment trust) portfolio also contributed positive performance, returning 9.02% for the year.
The current economic and interest rate environment continue to be monitored for clues on to how to best position the real estate portfolio going forward. Given the low level of interest rates, focus remains on managers who can drive value at the asset level through property improvements and on markets with long-term growth potential. Manager-specific performance was the main driver of the strong out-performance from the asset class this year. Expectations are to continue to actively commit new dollars to the asset class as market weight relative positioning is either maintained or increased over time.
Real Assets
As part of the change to the asset allocation, the target to real assets was increased from 7.5% to 10%. This was both a reflection of a consistent flow of opportunities from the space and of MPERS’ historical overweight to the asset class. The diversification and inflation participation qualities of the portfolio remain attractive in the current market environment. The portfolio returned 6.55% during the fiscal year, outperforming its benchmark return of 5.71%. Performance was driven by solid returns out of the energy and metals and mining portfolio, which offsets weakness in the infrastructure allocations and slightly positive returns from the timber strategy. Since the inception of the asset class it has generated 6.6% annual returns, outperforming its benchmark of 5.6%.
New commitments are balanced across various sub-strategies in the portfolio. The portfolio is well balanced between energy (42%), timber (30%), metals and mining (14%) and infrastructure (14%). The energy and metals and mining exposure continues to be mixed and driven by volatility within the commodity price market. The timber exposure delivered a small positive return of 2.4%. The overall construction of the timber portfolio should serve as a low-volatility diversifier to other volatility strategies within the portfolio. The pace of commitments is expected to slow in the coming years as a reflection of the overweight to the asset class.